
This post was written by Robert C. Schoen, associate professor of mathematics education and associate director of the Florida Center for Research in Science, Technology, Engineering, and Mathematics at Florida State University, and Gizem Solmaz-Ratzlaff, doctoral candidate in mathematics education in the School of Teacher Education at Florida State University and COS Ambassador.
When we tell non-researcher friends about data sharing and open science, the most common reaction is, “Yes, of course. Isn’t that how science is supposed to happen?” Many researchers and non-researchers agree, open science is simply how science should be conducted in the digital era.
The sharing of data and replication code is a major component of open science. Data sharing demonstrates a commitment to transparency, reproducibility, and scientific advancement. Shared data represents a valuable resource and can open the door to new discoveries. Sharing data also has the potential to support equity in the research endeavor by creating opportunities for researchers who don’t have resources to undertake primary data collection but do have the capability to make important discoveries from the data.
Primary data collection often requires extensive investment and resources. Sharing data increases the potential return on that investment. Some of those additional returns might occur right away, others might occur decades later after new methods of analysis have become available or after related data have been created and can be leveraged.
Several years ago, the Schoen Lab set a goal to share data. The driving force was the belief that researchers are not expected to be omniscient or produce findings that support hypotheses, but researchers do have an obligation to be transparent and disclose what they did and what they found. Word limits in published articles simply don’t allow enough space to explain methods and procedures in a manner that supports full disclosure. Data-sharing repositories create an opportunity to enhance transparency and reproducibility.
Deciding to share data is easy. Learning how to share data well has been difficult. Shared data must be organized, formatted, and documented in a manner that is accessible and supports accurate interpretation. Sharing data with those who were not involved in data collection or management requires researchers to acquire a specialized skillset and make changes to their data management protocols.
Because data management and sharing have not traditionally been an integral part of graduate-level training in education, we did not initially know how to do the data management (e.g., cleaning, wrangling, coordinating among members of the team) in a reproducible manner or according to industry standards. We didn’t even have a clear vision of what the final product should include.
Our first step toward realizing the goal involved searching online for concrete examples of shared educational data that we might emulate. Although there are many excellent examples of shared data created and shared by government entities, our search found very few examples of shared data and replication code from individual educational researchers. The examples we did find were lacking critical information. Some claimed to contain data where no actual data could be found. The few that we did find often did not provide data dictionaries, therefore requiring potential users to guess the meaning of variables. Coming up mostly empty-handed after our searches, we decided to invent a model for sharing data that would embody a concrete realization of a vision for shared data that might be useful to our own team and others. The rest of this blog post describes the ways we have organized data for the purpose of sharing.
Some of the products that we created and shared can be found in the Foundations for Success: Developing Effective Mathematics Educators through Cognitively Guided Instruction project. The Foundations for Success study was an experimental trial of a mathematics intervention involving random assignment of over 200 schools and spanning four school years. The project involves primary data collection concerning implementation of the intervention, teacher attributes (e.g., knowledge, beliefs, years of teaching experience, job roles), instructional practice, and student demographics, attitudes, and achievement. Figure 1 depicts some of the major baseline and outcomes data gathered over the course of the three-year study.
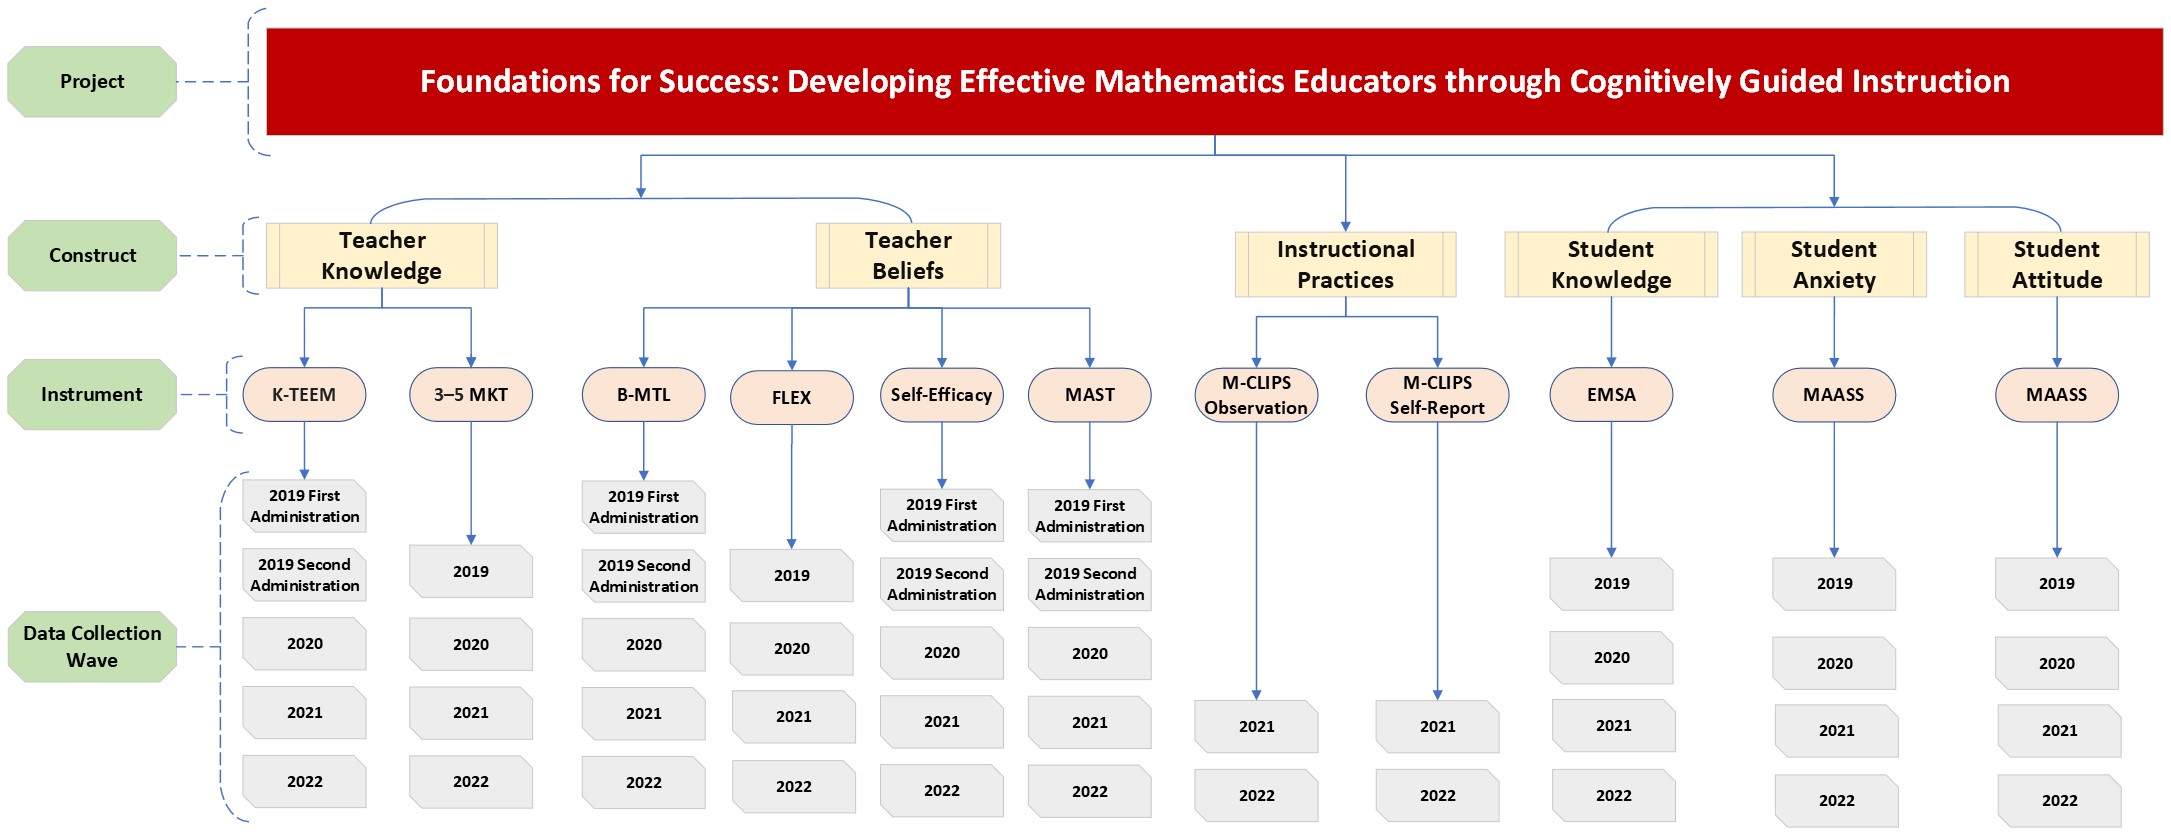
Figure 1. Schematic diagram of the student and teacher data gathered in the Foundations for Success study. (Click to expand image.)
The sheer size and complexity of data in the Foundations for Success study can be overwhelming, so we used the projects and components features in OSF to create a directory structure for shared data from the study. We created separate projects in OSF for each instrument and wave of data collection. Those instrument-specific projects include the K-TEEM, which measures knowledge for teaching early elementary mathematics, the B-MTL, which measures teacher beliefs about mathematics teaching and learning, and MAASS, which measures student mathematics anxiety and attitudes. The overall project contains distinct components for each wave of data collection when the instrument was used. Instrument-specific pages contain general information related to the measures, such as their intended purpose, links to relevant publications, how to access the instrument, and data collection points for each specific instrument.
Another instrument created in the Schoen Lab is Knowledge for Teaching Early Elementary Mathematics (K-TEEM). Under the K-TEEM project in OSF, each data collection wave in the Foundations for Success study has its own component. As described in the OSF help guide, components are sub-projects below the main project. K-TEEM was administered in four waves of data collection during the Foundations for Success study. We organized the data corresponding to those four waves in four separate components: 2019 First Administration, 2019 Second Administration, 2020, 2021, and 2022. Figure 2 shows the project page created for the K-TEEM measure.
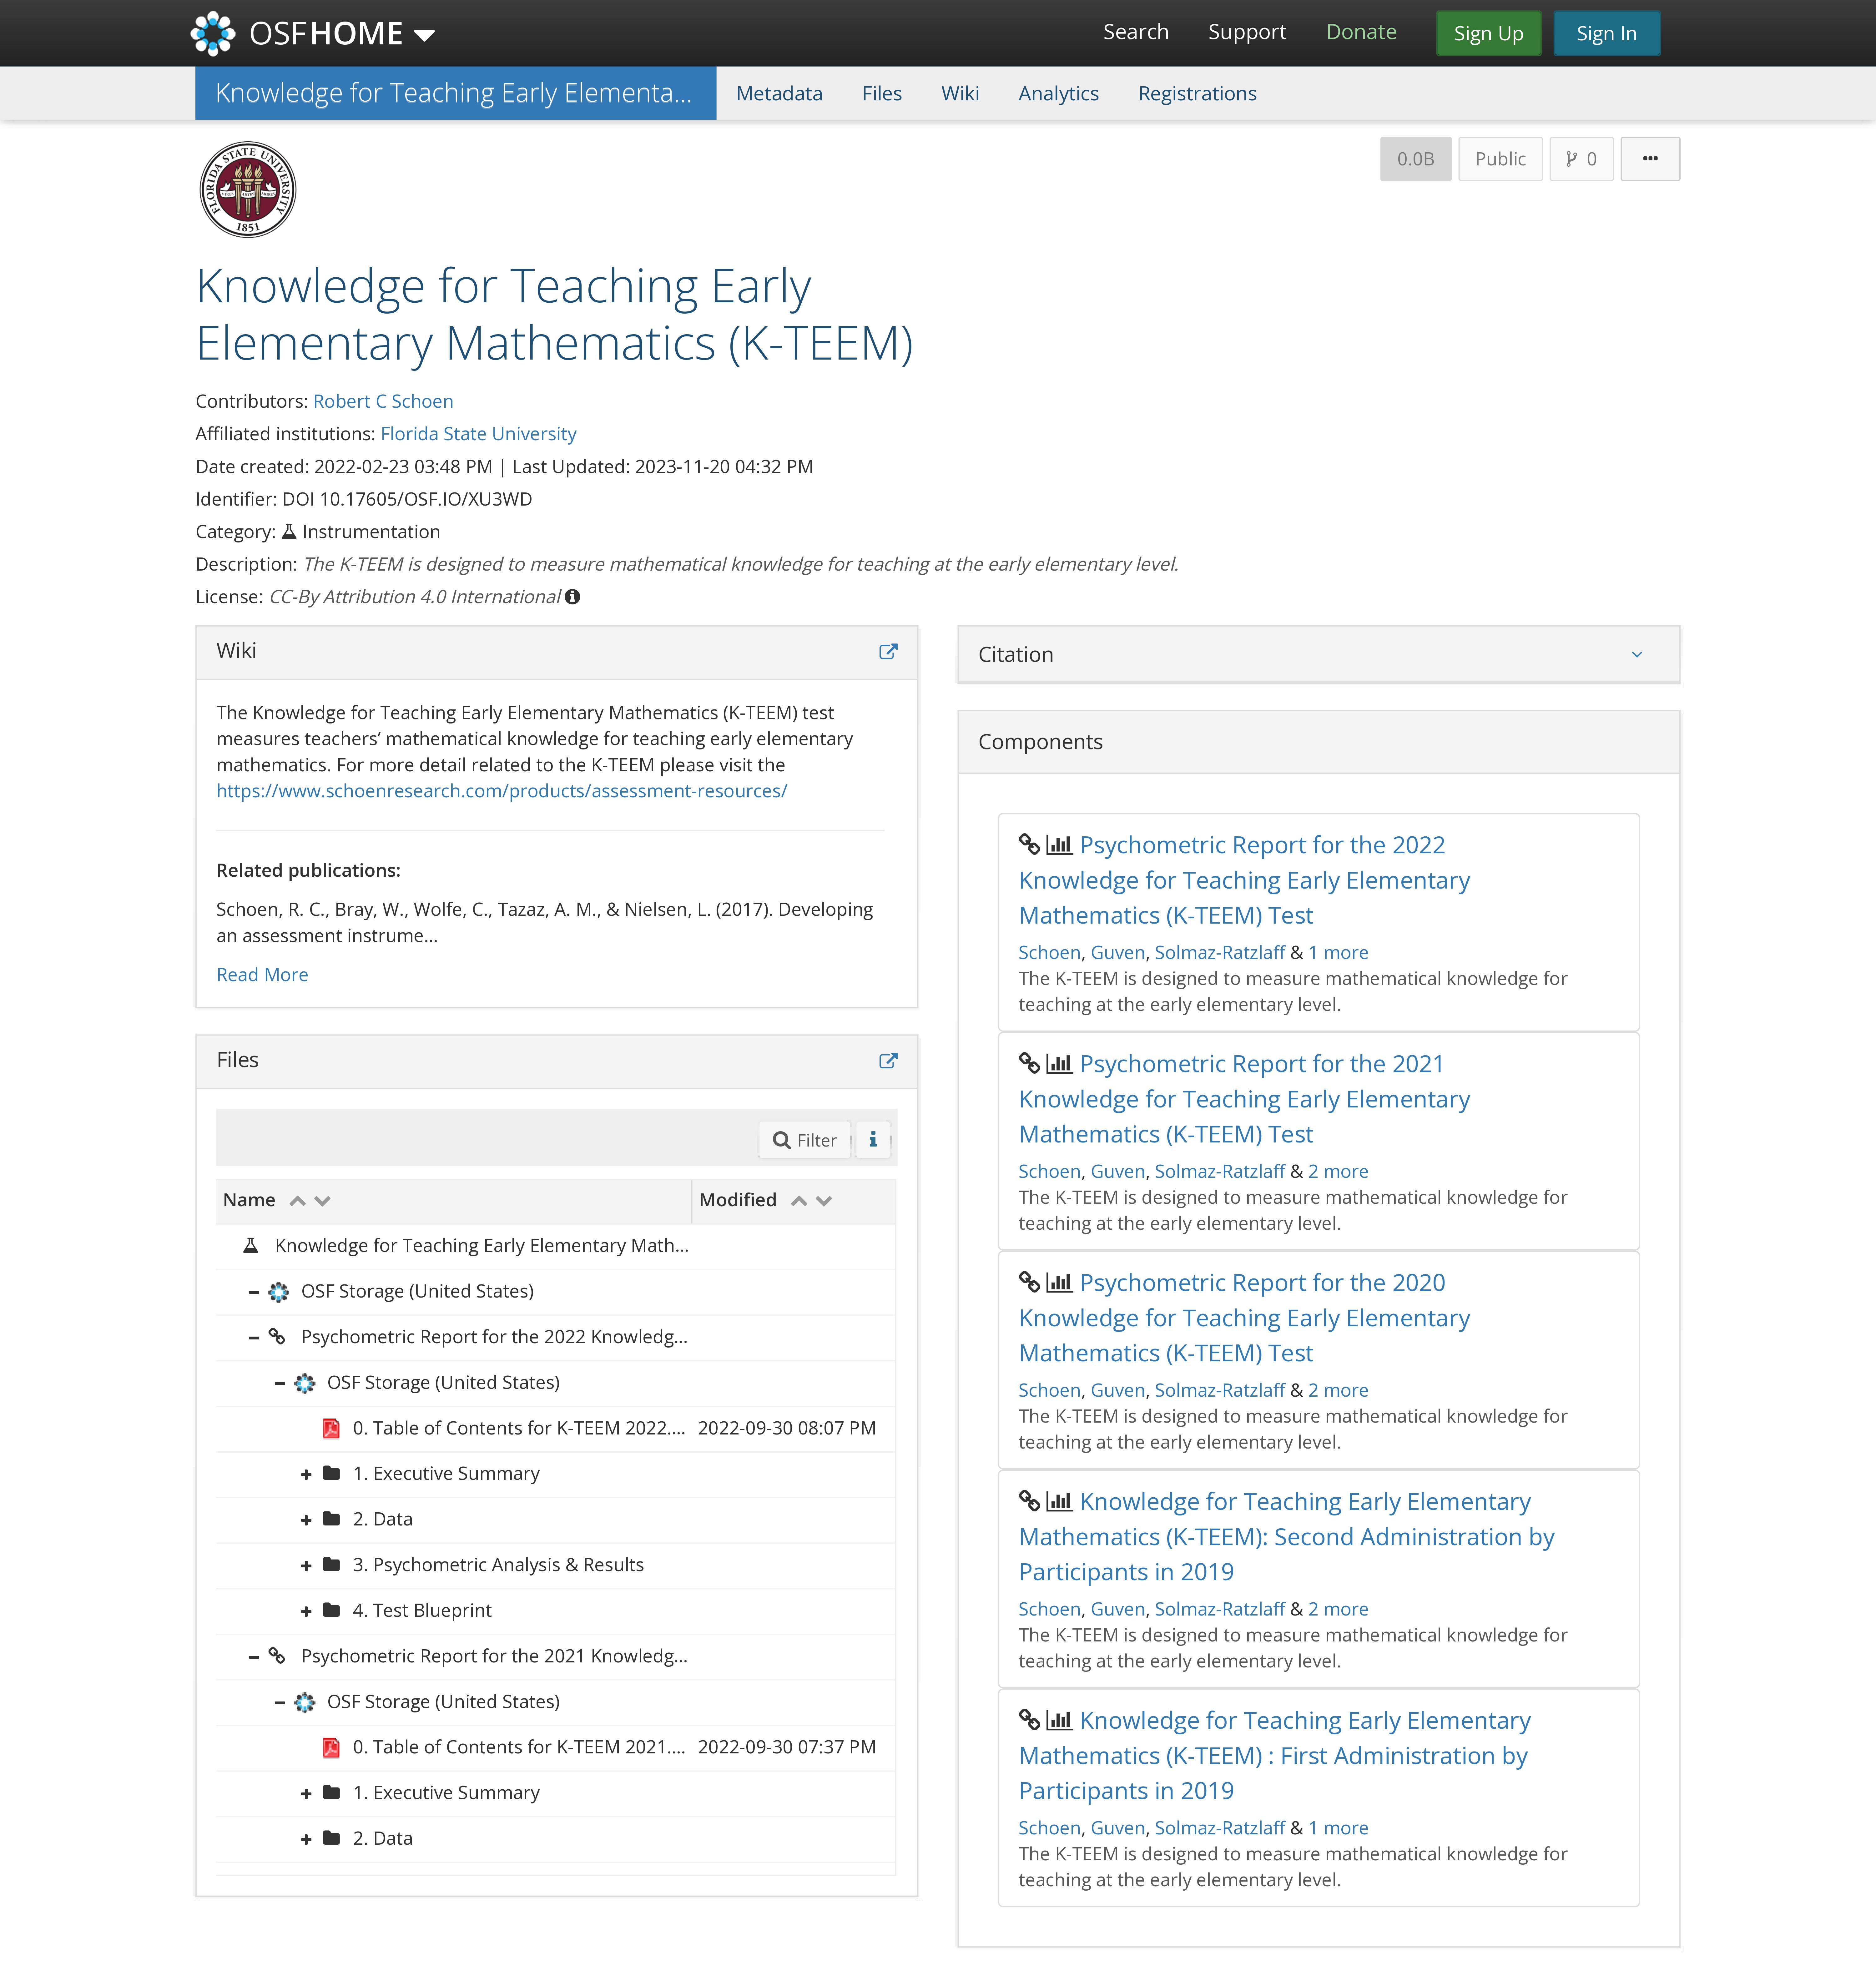
Figure 2. Overall K-TEEM project page with several components.
Figure 3 shows how the components are structured. Each component contains a Table of Contents, which provides a map of the information shared in the component with hyperlinks to each of the associated files. The Executive Summary folder offers a general summary of all the analyses and decisions made, including demographic information about the sample. The Data folder contains the initial data set and, if applicable, subsequent versions of the data that were created during the process of review and analysis. A data dictionary is always included in the data folder to list all the variables in the dataset, provide descriptions of what those variables represent, and provide other background information that may aid interpretation. The Psychometric Analysis & Results folder contains a record of the psychometric analyses conducted. It includes information about decisions, replication code (syntax used for analyses), and output files generated during the process. Test blueprints are also included to provide information about different versions of the specific instrument. Open materials is part of open science framework, which is why we provide blueprints and—when we can—items that are included in the instruments.
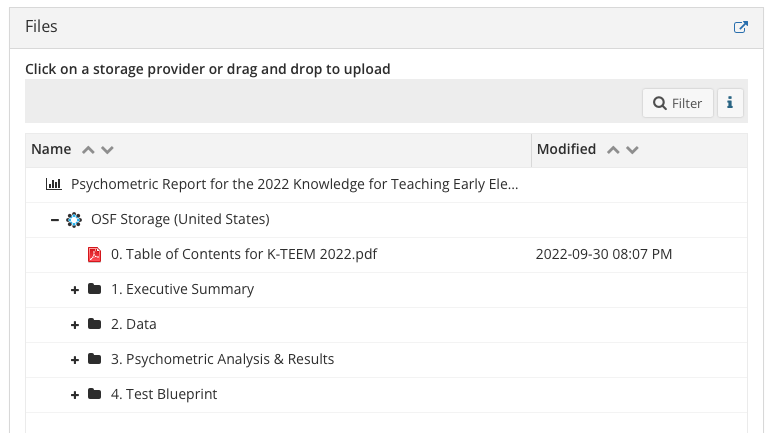
Figure 3. Structure of each component, which corresponds to a unique instrument and wave of data collection.
We wish to underscore the point that the data dictionary is an essential piece to include with shared data. Apart from the data frame itself, if there is only one object to include in a shared data set, it is the data dictionary. Future users of the data (which includes us in a few years) need to know what the variables and values represent and how they were gathered.
There is a lot more data that we could potentially share in the projects but have thus far chosen not to share. For example, we have the initial raw data files, meeting notes, ReadMe files, and other forms of documentation that were created during the data management process. We keep those documents internally, but we have not been including them in the published data. Part of the reason for not sharing all those documents is that they may include personally identifiable information, and we have legal and ethical obligations to protect the privacy and confidentiality of research participants.
The amount of time and effort required to manage and share data is vast. Clear communication among team members is paramount. Devices such as swimlane diagrams, style guides for naming variables and establishing directory structures, and other protocols can provide useful support for coordinating among members of the team.
One valuable side effect of the data-sharing efforts is the positive effect it has had on the data-management workflow and the quality of the data and related documentation. It is scary to share data, because it creates opportunity for somebody to find errors that we might have missed. Of course, this also is one of the many reasons why researchers should share their data and replication code. It is important to be able to identify potential errors and correct them promptly for the benefit of the scientific enterprise. Nevertheless, the shift from not sharing to sharing data can induce some anxiety, which causes us to create additional systems of internal review and replication—processes that have caught errors before they impacted publications.
Deciding how to structure the data frames and other accoutrement in a manner that could be comprehended by others for use in secondary analysis or to reproduce our findings is a challenge, and we are still working to improve the model. It takes a lot of time and effort to create the structure, generate the documents, and review everything for accuracy and coherence. We aspire to begin using R Markdown or Quarto to automate some of the data visualization and reporting in the near future. Recent efforts also include development of Interpretation and Use Statements for various measures, and we might return to the published projects and add those at a later date.
Learning to share data has been a long and arduous process, but we remain steadfast in our commitment to data sharing. For the Schoen Lab, data sharing is a way to enhance transparency and magnify the potential legacy of the effort we put forth in primary data collection. It is exciting to know that we are contributing to the movement to enhance the transparency and value of educational research. We sincerely hope that the measures, the data, the replication code, and the model for sharing the data can be useful to other researchers.
We encourage readers to examine the structures we have used to share data. We hope these examples can provide others with examples to follow (and improve upon). If you find the model (or the data) to be useful, or if you have suggestions for ways to improve the model, we will be happy to hear from you!
About the authors
 Robert C. Schoen (rschoen@fsu.edu) is an associate professor of mathematics education and associate director of the Florida Center for Research in Science, Technology, Engineering, and Mathematics at the Florida State University.
 Gizem Solmaz-Ratzlaff (gsolmaz@fsu.edu) is a doctoral candidate in mathematics education in the School of Teacher Education at Florida State University and serves as a Center for Open Science Ambassador.
6218 Georgia Avenue NW, Suite #1, Unit 3189
Washington, DC 20011
Email: contact@cos.io

Unless otherwise noted, this site is licensed under a Creative Commons Attribution 4.0 International (CC BY 4.0) License.
Responsible stewards of your support

COS has earned top recognition from Charity Navigator and Candid (formerly GuideStar) for our financial transparency and accountability to our mission. COS and the OSF were also awarded SOC2 accreditation in 2023 after an independent assessment of our security and procedures by the American Institute of CPAs (AICPA).
We invite all of our sponsors, partners, and members of the community to learn more about how our organization operates, our impact, our financial performance, and our nonprofit status.