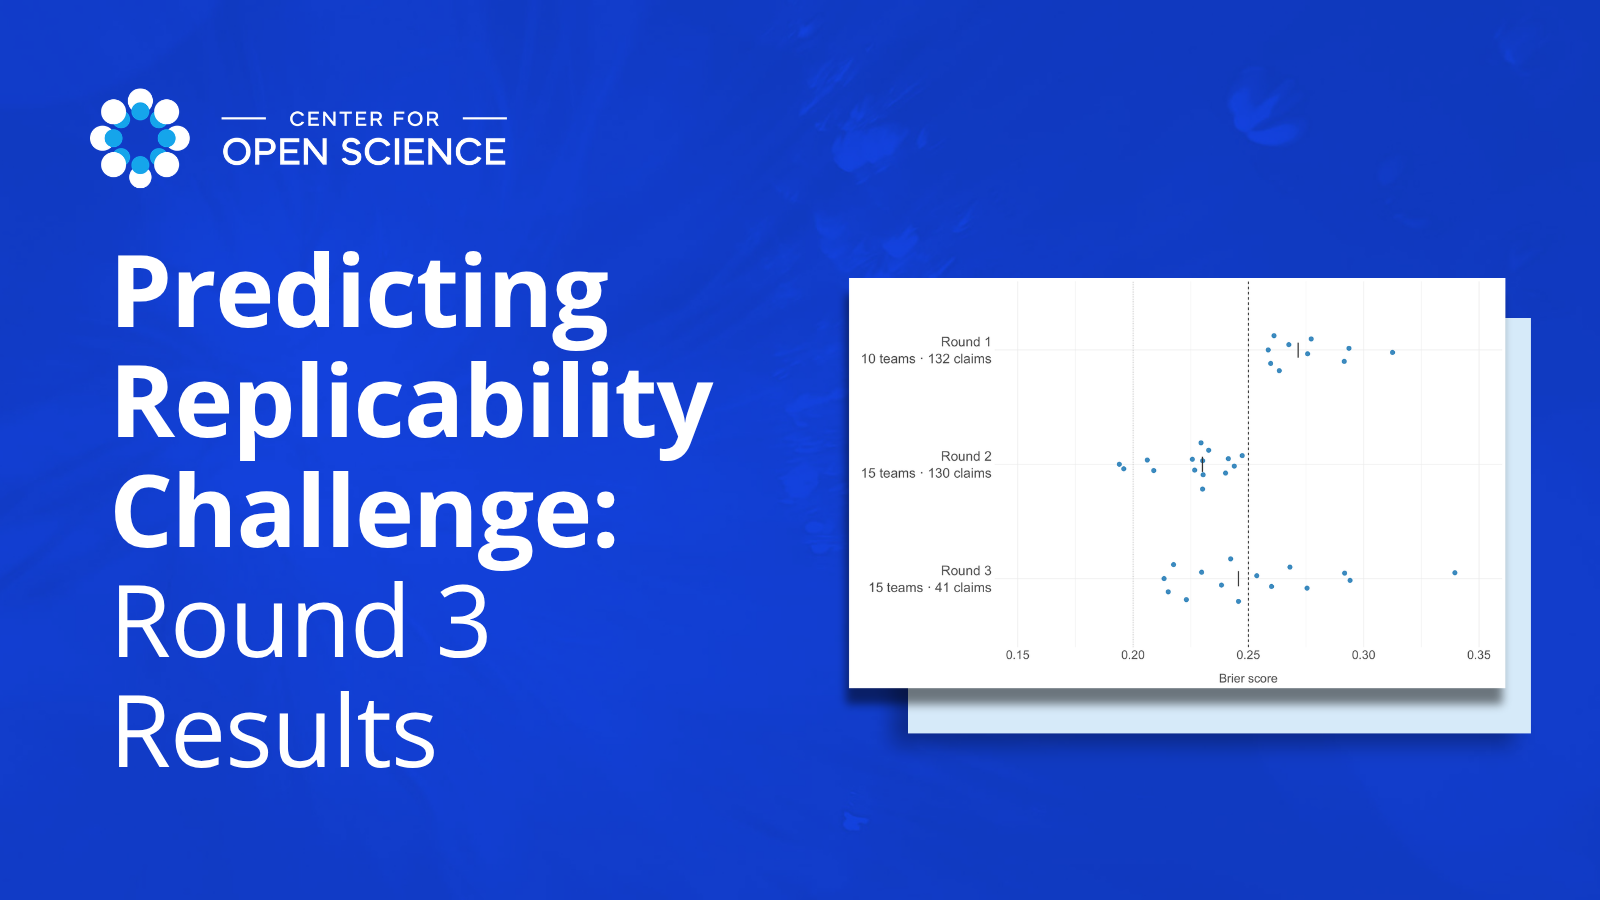
COS launched a public competition in 2025 to test automated methods for predicting whether a research claim would be successfully replicated in a new sample of data. Through three rounds, participating teams were provided training data from existing replication studies along with metadata about a set of original claims. Teams were responsible for generating 0-1 confidence scores that measured the likelihood of successful replication, which were evaluated against the corresponding outcomes of replication attempts conducted on those claims. In the first round, 10 teams evaluated 132 social-behavioral claims, and no teams outperformed a baseline Brier score of .25, which represents predictions with no information about the underlying claims. The second round featured 15 teams predicting 130 claims and showed substantial improvement, with each team’s best-performing model outperforming the same .25 baseline.
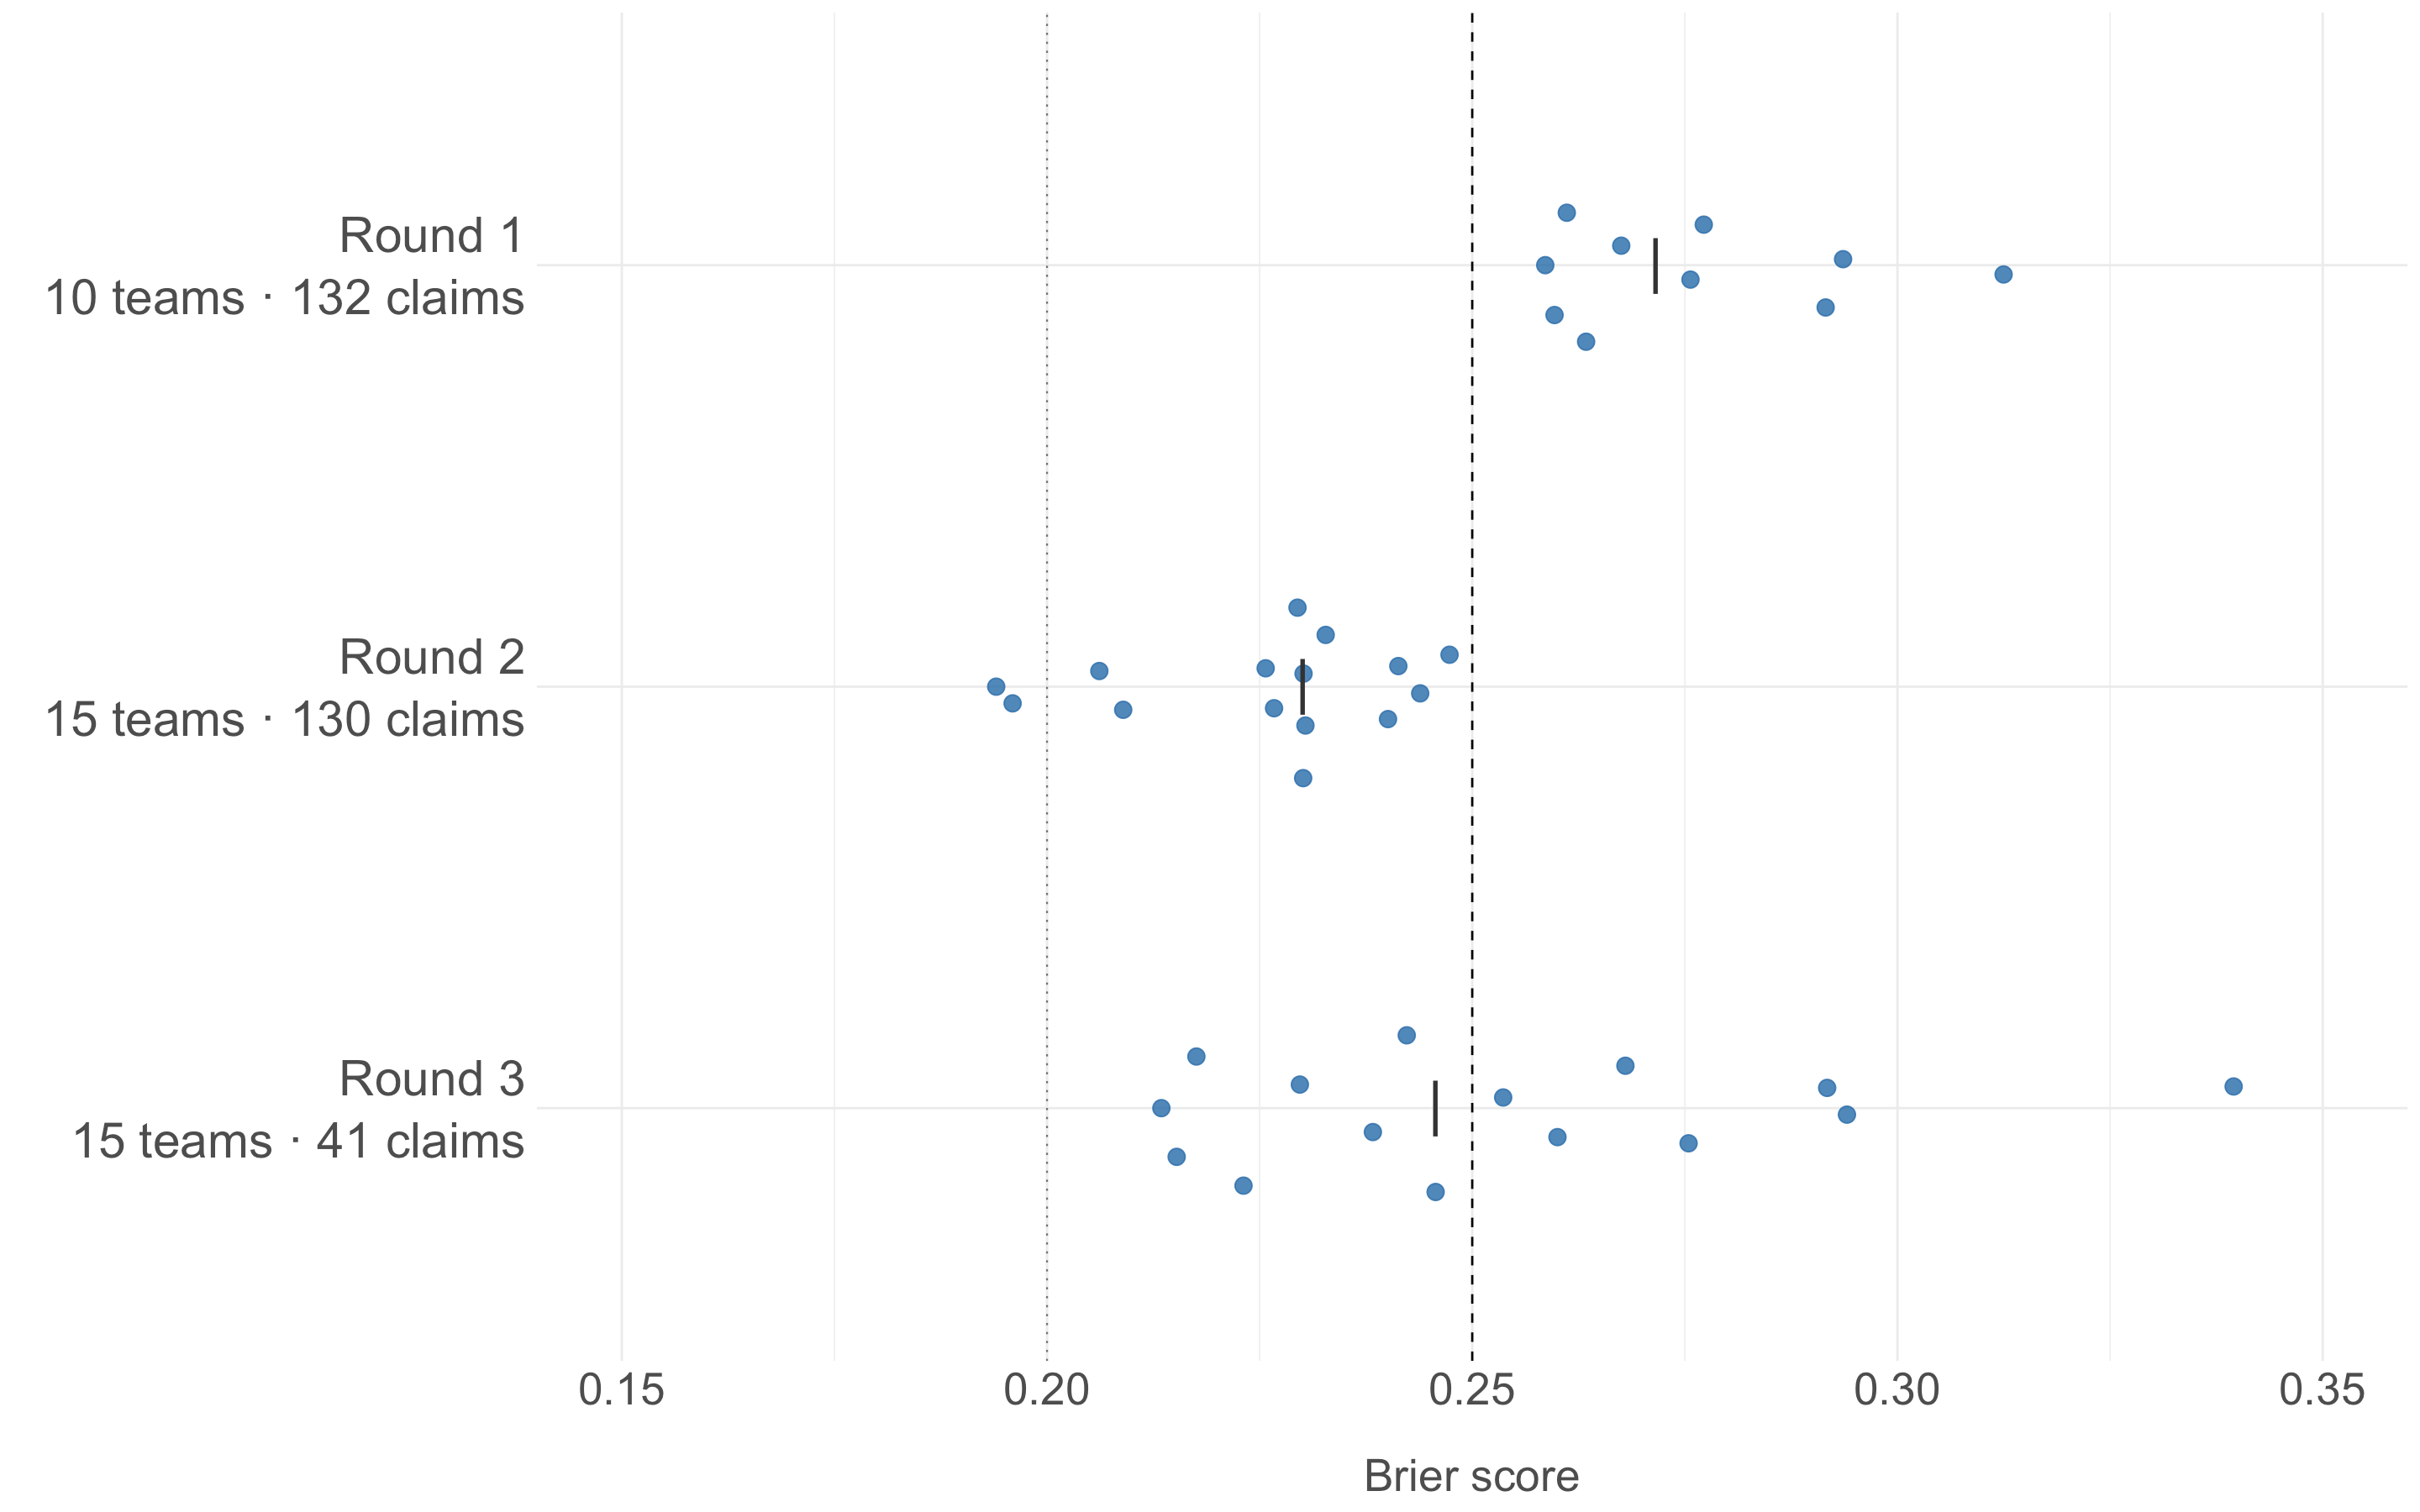
Fifteen teams participated in the third and final round of this public competition, with six teams joining for the first time. Teams submitted predictions for 46 claims; 41 had completed replication attempts as part of the Replicability Project: Health Behavior and were included in the performance analysis. The figure below plots each team’s best-performing model from each round. . Lower Brier scores indicate better performance. Whereas no teams outperformed the .25 baseline in Round 1 and all teams did so in Round 2, just over half of the teams outperformed this benchmark in Round 3 (8 of 15 teams). The median Brier scores in each round are signified by the tick marks and tell a similar story: Rounds 2 and 3 both represent improvement relative to Round 1, but the wide spread of Round 3 results, including several relatively high Brier scores, contrasts with the more consistently strong performance in Round 2.
Unpacking model performance
The Brier score is composed of three elements: the inherent uncertainty of the prediction task, which gets larger as the outcome’s occurrence gets closer to 50%; resolution, which assesses how well the prediction model distinguishes successful from unsuccessful cases by assigning them higher scores; and calibration, which assesses how closely the predicted replication rates correspond to the actual replication rates. The uncertainty estimates across the three rounds are nearly identical (.249, .247, and .249), so differences in task uncertainty are unlikely to explain the weaker Round 3 performance.
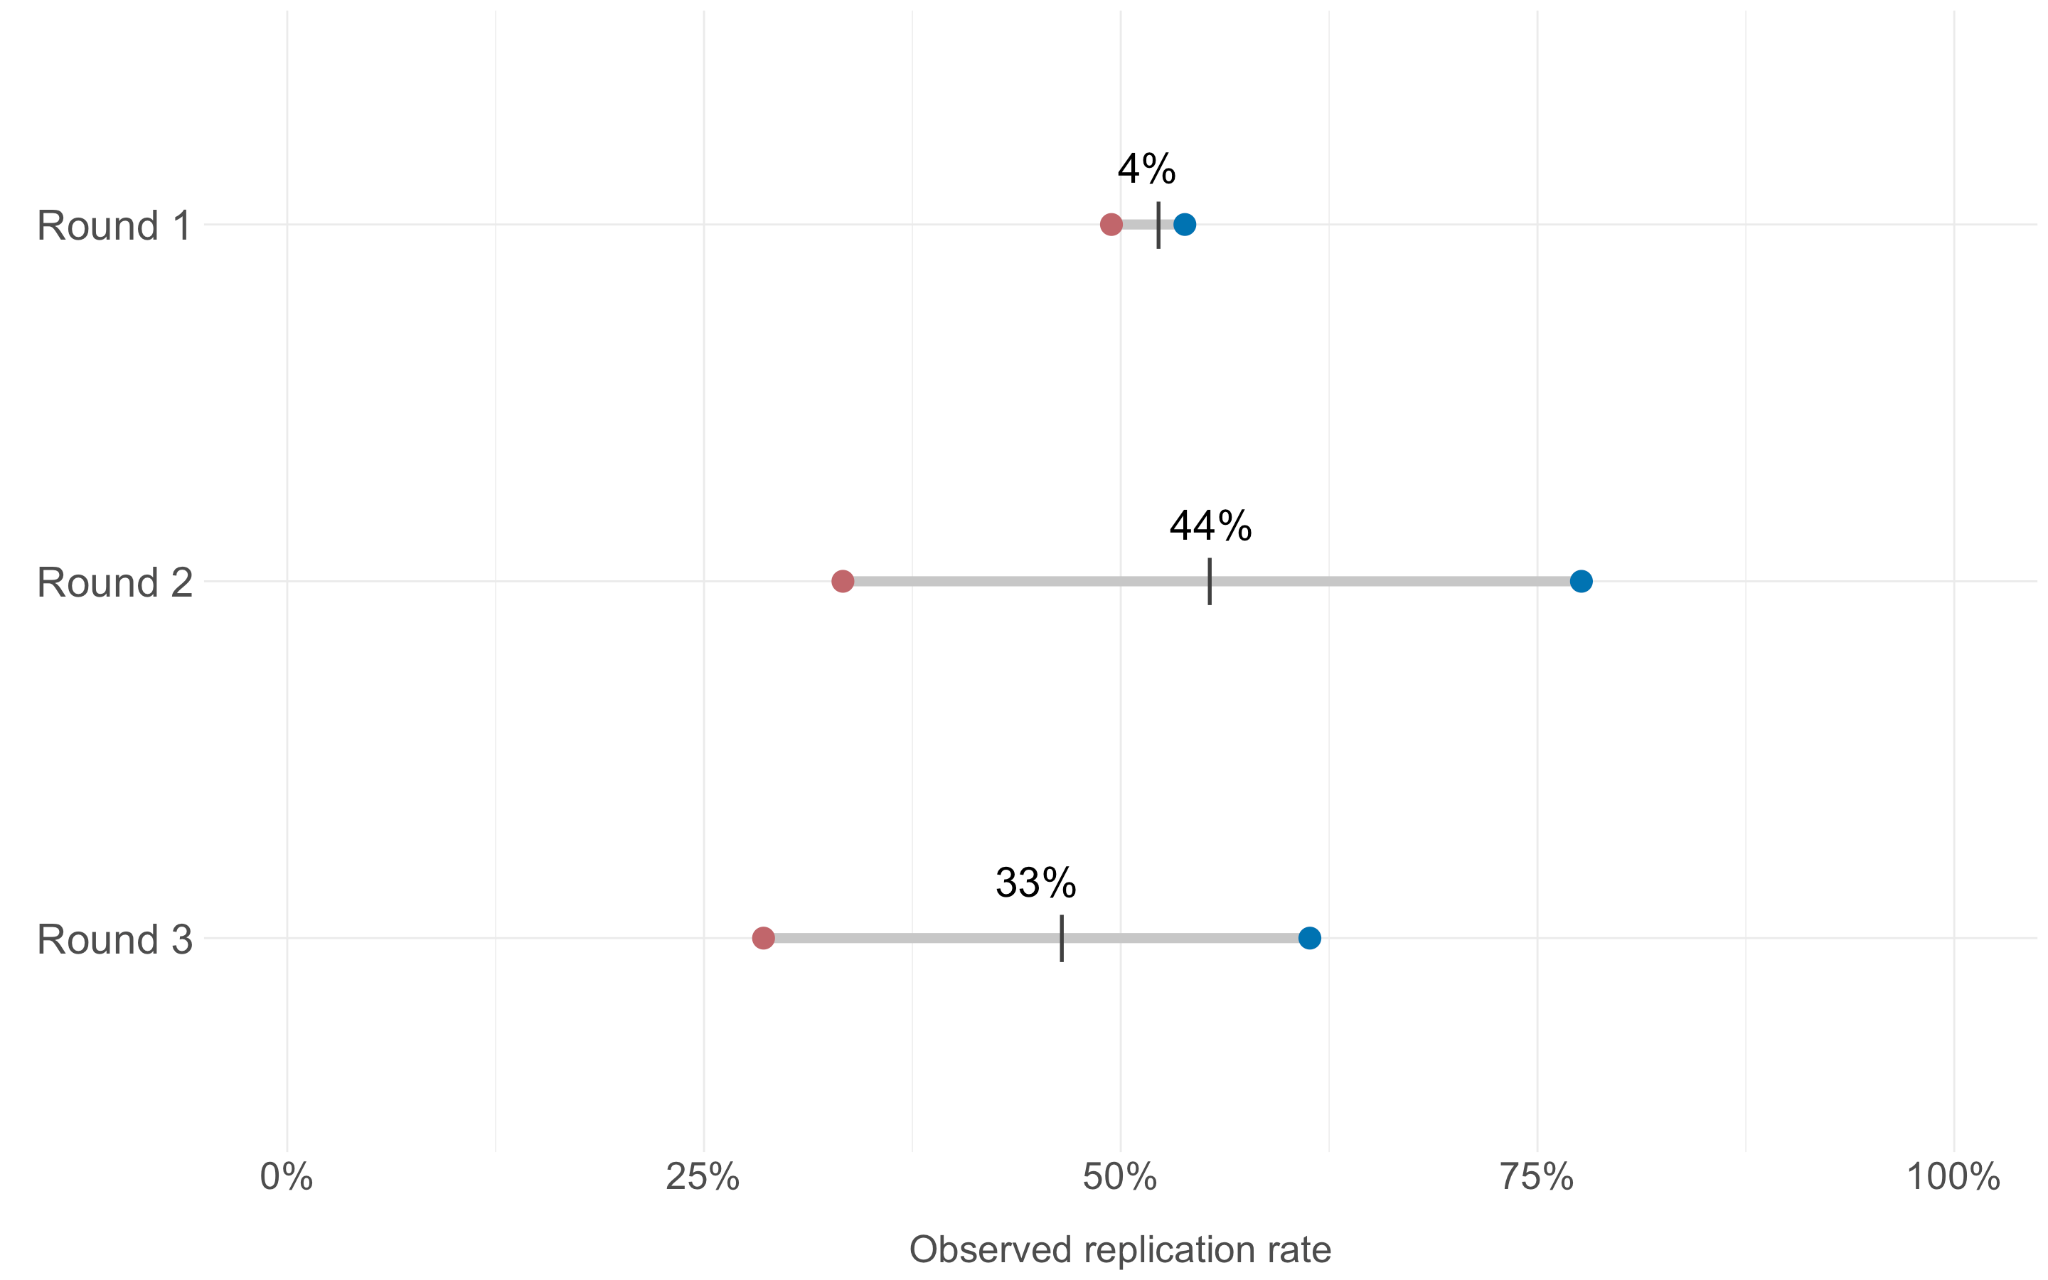
The models’ resolution is visualized below, separated by round. The red and blue dots represent the observed replication rates for the claims that received the bottom 20% and top 20% of confidence scores from teams’ predictions, respectively. For the models to demonstrate resolution, the replication rates of the top claims need to be higher than the replication rates of the bottom claims, and we see that this holds across each round. In the first round, though, the models showed only limited ability to distinguish replicable from non-replicable claims: the top claims were only four percentage points more likely to be successfully replicated than the bottom claims. In the second round, by contrast, the models did a much better job of distinguishing the two sets of claims. Approximately 78% of the top-rated claims in the second round successfully replicated, compared to just approximately 33% of the bottom-rated claims. The Round 3 models showed nearly as much separation, with observed replication rates of 61% among the top-rated claims and 29% among the bottom-rated claims. In this figure and the one below, each team is represented in each round by the set of predictions that generated the lowest Brier score (i.e. each team’s best performing model).
The modest drop in resolution appears to explain part of the Round 3 performance decline, but the figures suggest that weaker calibration may have played a larger role. The figure below visualizes calibration across rounds by splitting claims into 10 bins, each with 0.1 width to represent the full range of possible confidence scores. The height of each gray bar in the background reflects the expected replication rate in each bin: 35% of the claims in the 0.3-0.4 bin should successfully replicate, 65% of the claims in the 0.6-0.7 bin should do so, etc. The smaller bars plotted on top of the gray bars represent the actual replication rates of the claims in those bins.
From the orange bars, we see that in Round 1 the confidence scores assigned to each claim contain very little information about the likelihood of successful replication, since the replication rate in each bin is right around 50% regardless of how much confidence the bin represents. Calibration improved considerably in the second round – the height of the blue bars increased as the bins reflect more confidence, and it remains fairly close to the height of the gray reference bars across the plot. Finally, in Round 3 the observed replication rate increased across the horizontal axis but less consistently than in Round 2, and in the rightmost bins (reflecting the highest confidence of replication success) the replication rates are well short of their expected values, reflecting weaker calibration compared to the second round.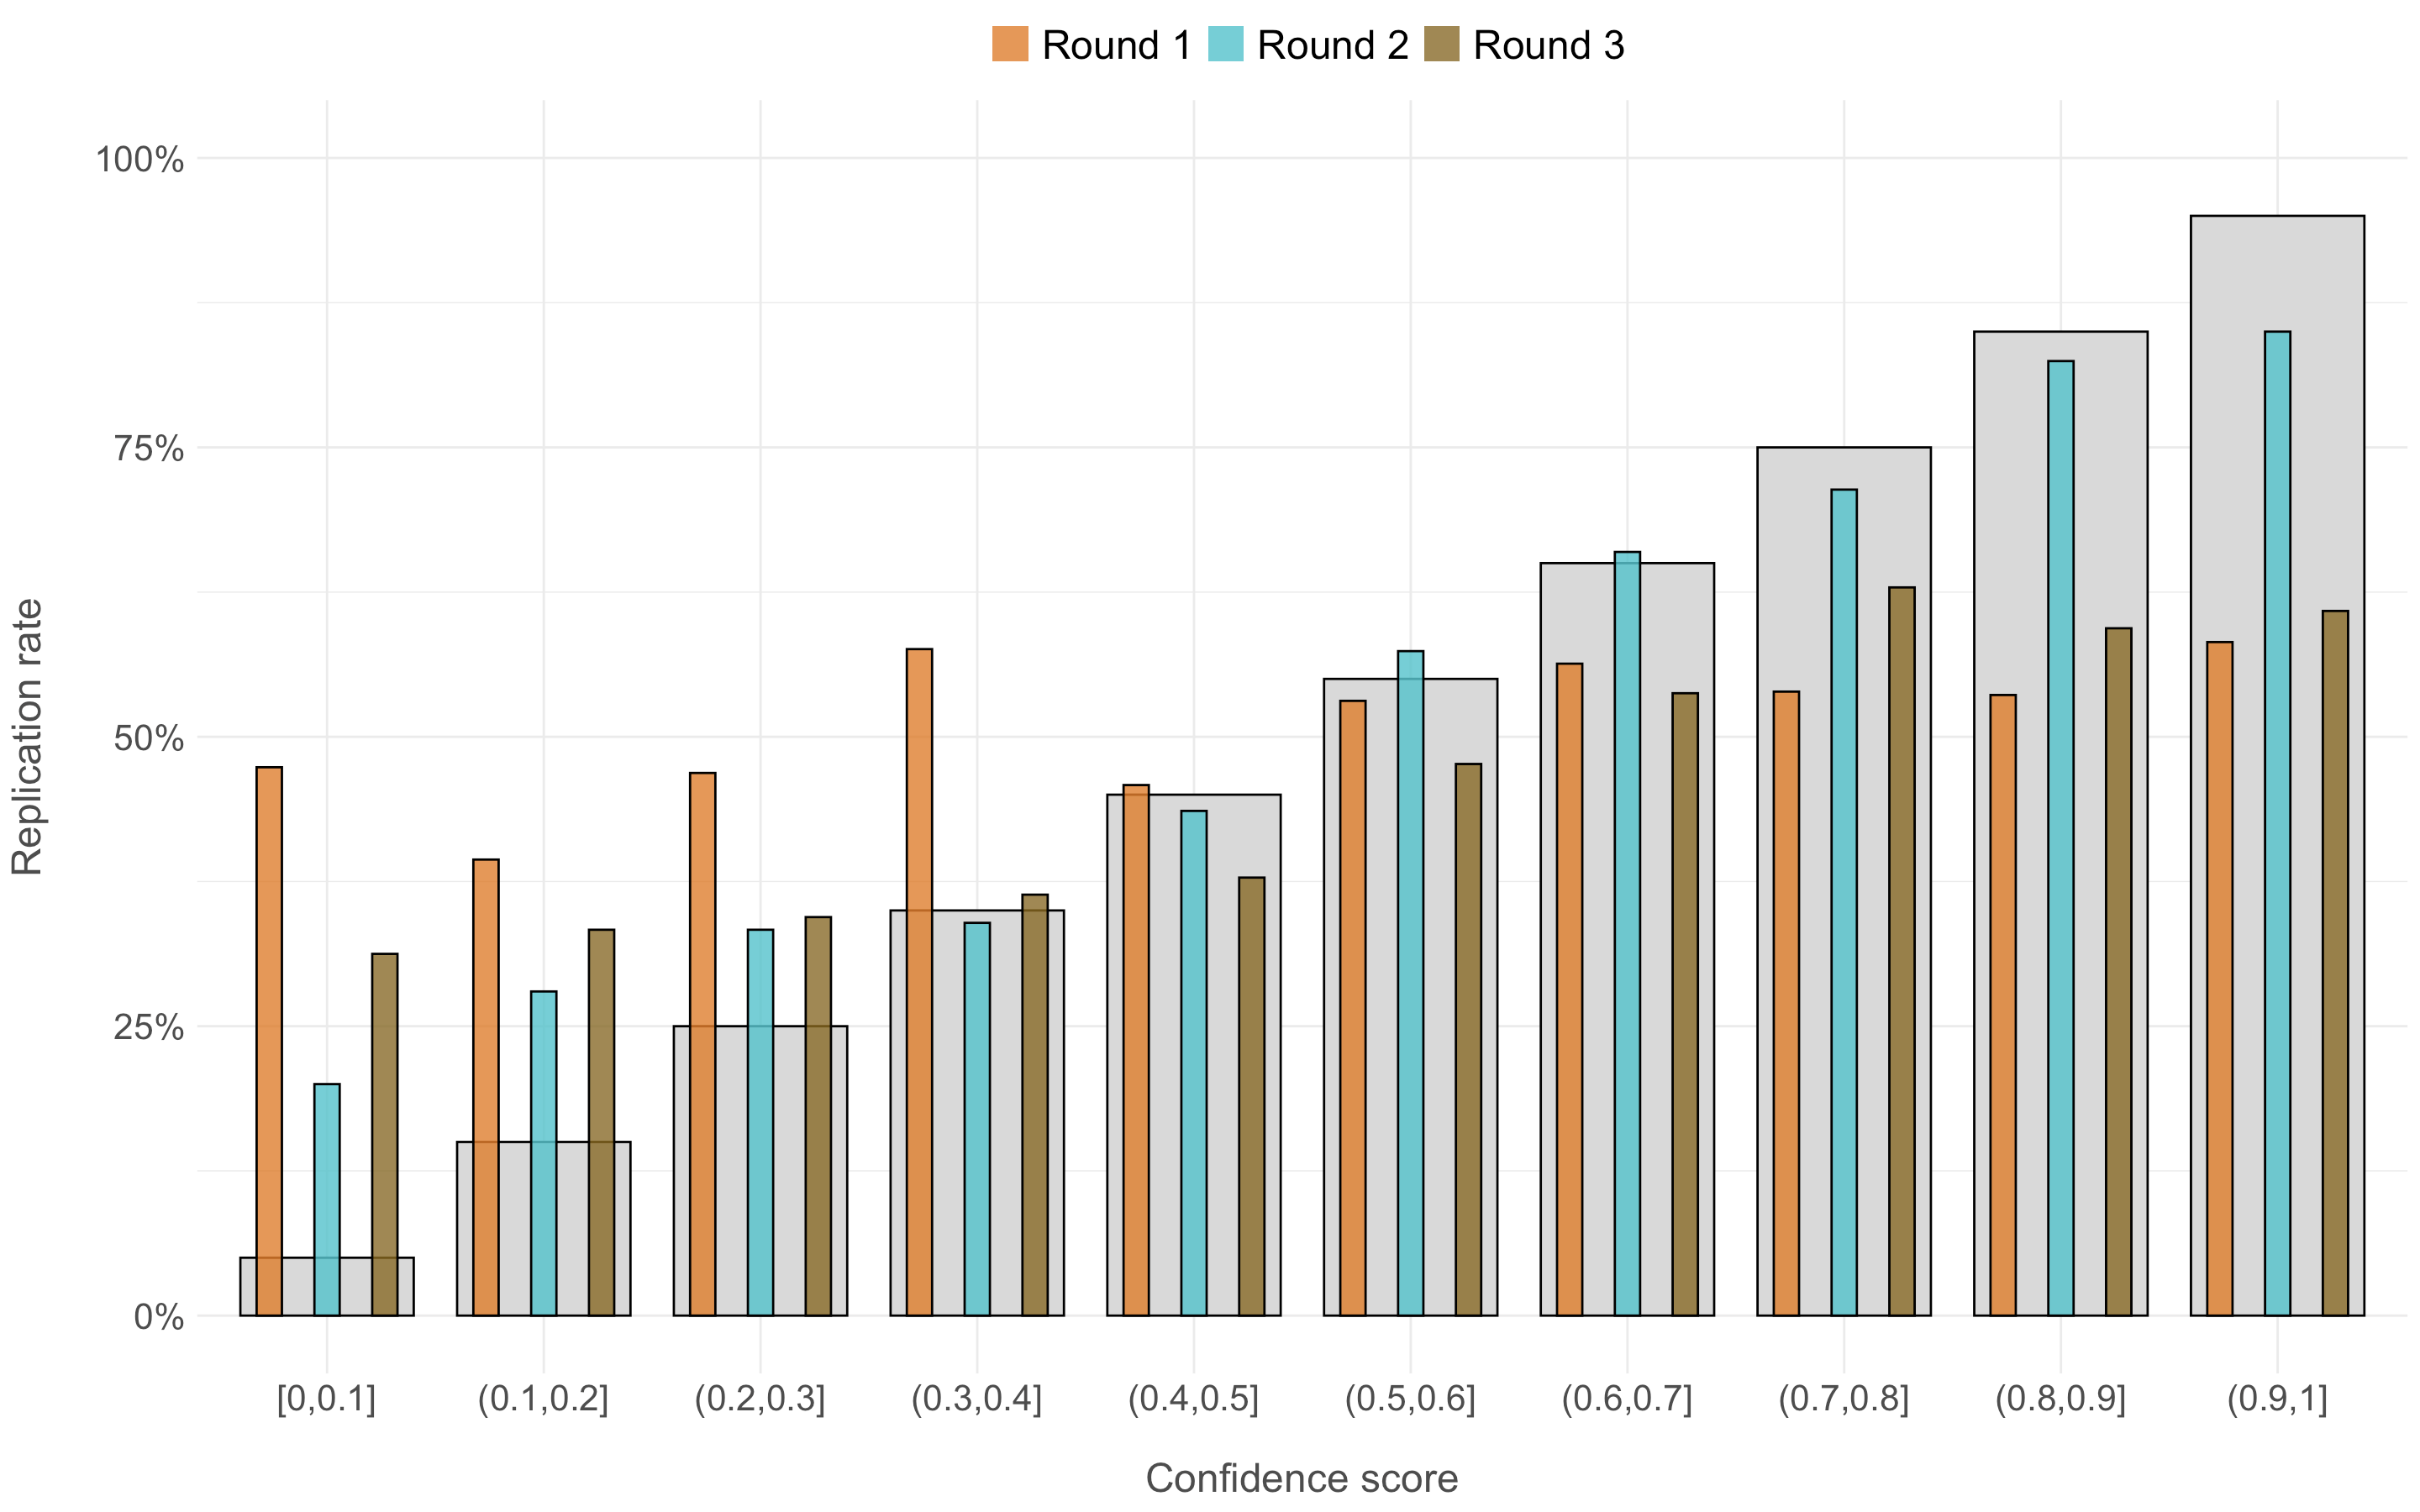
What explains this falloff in calibration? Part of the answer may rest with the observed replication rates in each round, which were 52% and 55% in the first two rounds but 46% in the third round. Since teams in the third round had access to the prior rounds’ outcomes, predictions may have been anchored to a replication rate which was approximately 10 percentage points higher than what was actually observed. As a more general difference, replication outcomes in the first two rounds were generated from SCORE, while they were drawn from the Replicability Project: Health Behavior in the third round. Finally, the substantially smaller sample size (41, vs 132 and 130) might also caution us against reaching strong conclusions regarding calibration from this analysis alone.
COS will share a more thorough analysis later this fall of what was learned from the Predicting Replicability Challenge, what improvements it represents over automated predictions from the SCORE project, and how these data and results inform future developments in the automated assessment of research credibility.

6218 Georgia Avenue NW, Suite #1, Unit 3189
Washington, DC 20011
Email: contact@cos.io

Unless otherwise noted, this site is licensed under a Creative Commons Attribution 4.0 International (CC BY 4.0) License.
Responsible stewards of your support


COS has earned top recognition from Charity Navigator and Candid (formerly GuideStar) for our financial transparency and accountability to our mission. COS and the OSF were also awarded SOC2 accreditation in 2023 after an independent assessment of our security and procedures by the American Institute of CPAs (AICPA).
We invite all of our sponsors, partners, and members of the community to learn more about how our organization operates, our impact, our financial performance, and our nonprofit status.